

How to Draw Trendlines Correctly
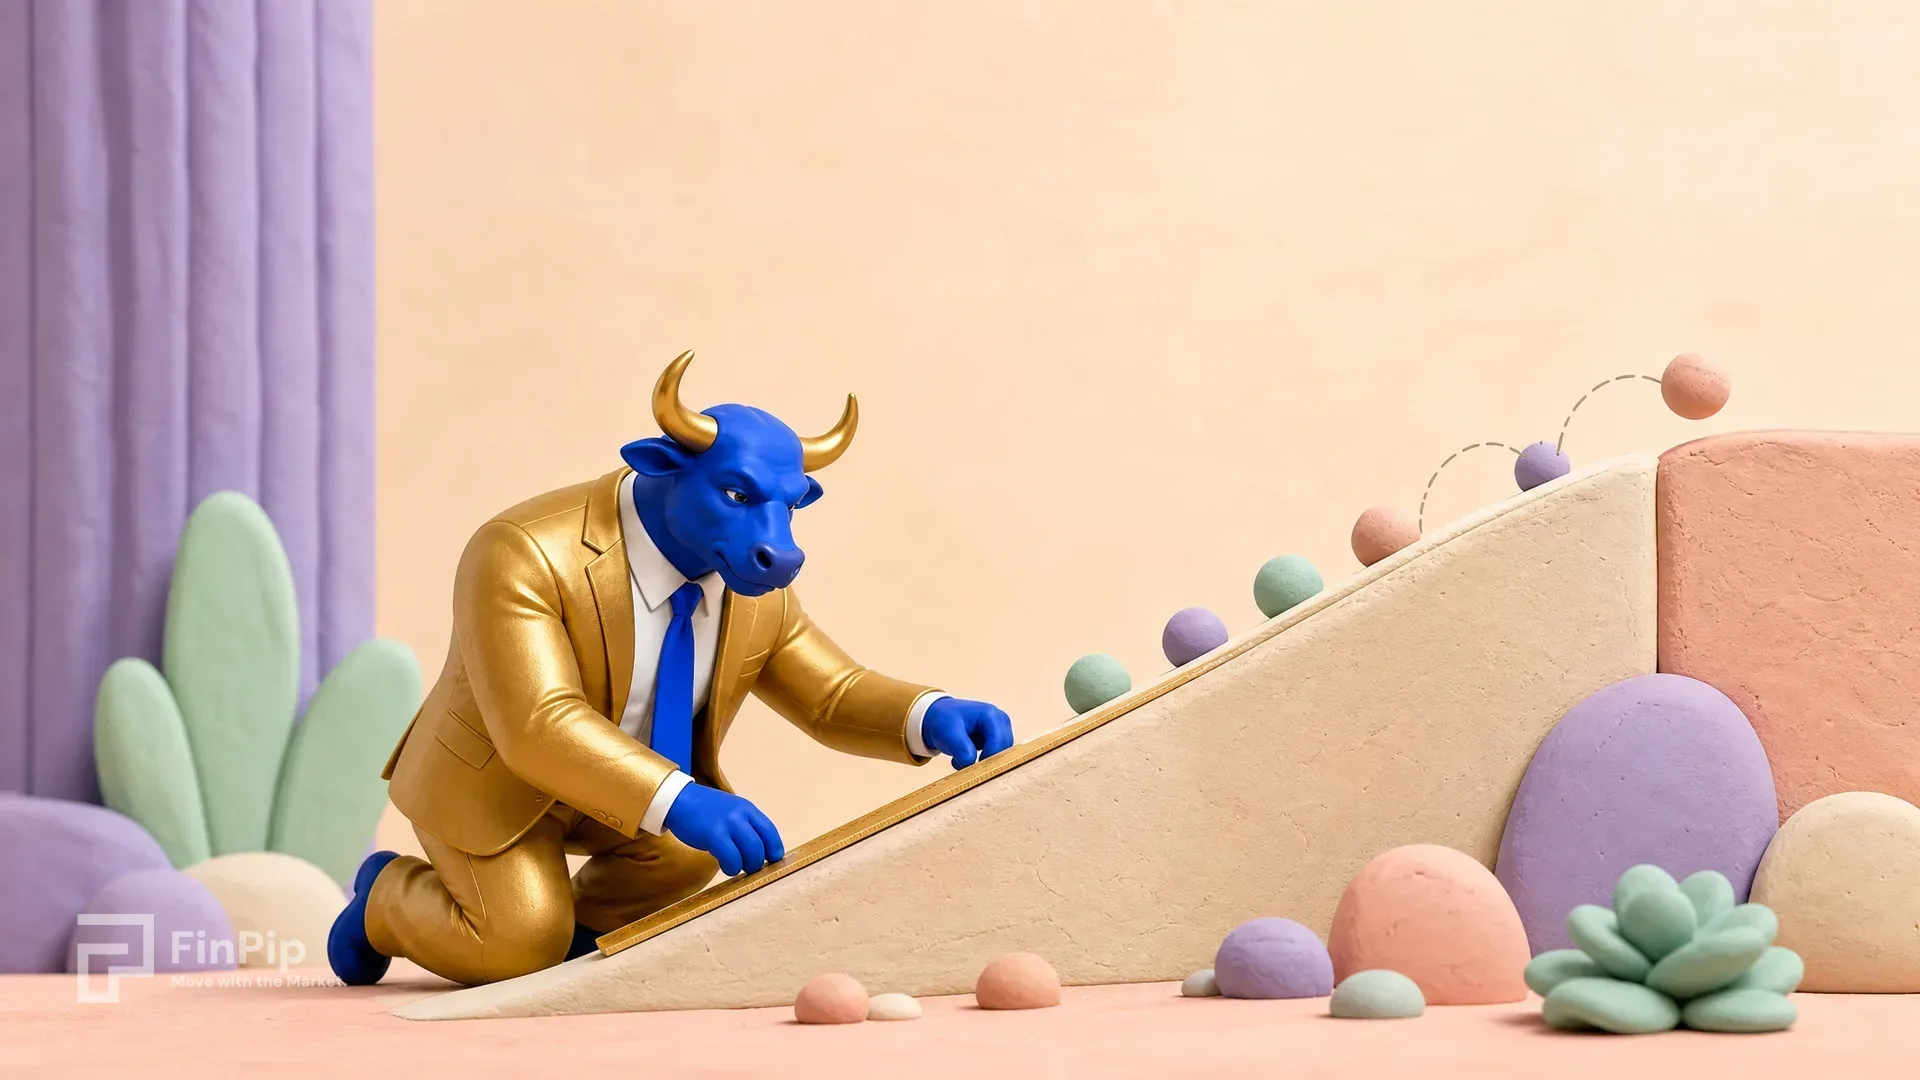
A trendline is one of the simplest tools in technical analysis — just a line connecting two or more points on a chart — yet drawing one correctly (and knowing when it’s genuinely broken) is a skill that takes real practice to get right.
What a Trendline Represents
A trendline is a visual summary of a trend: in an uptrend, it connects a series of rising swing lows; in a downtrend, it connects a series of falling swing highs. It’s essentially a diagonal, moving version of support and resistance — a sloped line the market has repeatedly respected.
Step-by-Step: Drawing an Uptrend Line
- Identify the trend first. Confirm price is genuinely making higher highs and higher lows before drawing anything — a trendline forced onto a directionless range is meaningless.
- Find the first significant swing low. Look for a clear reversal point, not a minor wiggle.
- Find the next significant, higher swing low. This is your second anchor point.
- Draw a straight line connecting the two lows, then extend it forward into future price action.
- Wait for a third touch. A line connecting only two points is a hypothesis. If price pulls back a third time and bounces near the line again, that third touch gives the trendline real technical weight.
Example: Suppose AUD/USD makes a swing low at 0.6480, rallies, pulls back to a higher low at 0.6520, rallies again, and pulls back a third time — touching almost exactly on the line drawn through the first two lows, around 0.6555, before bouncing higher again. That third touch is what turns a two-point guess into a trendline traders will actually watch and react to.
Drawing a Downtrend Line
The mirror process: connect a series of falling swing highs. For example, if gold makes a swing high at 2,430, falls, rallies to a lower high at 2,405, falls again, and rallies a third time to touch the line near 2,385 before turning back down, that third touch validates the downtrend line the same way it would in an uptrend.
Trendlines vs. Trend Channels
Once you have a valid trendline, you can add a second, parallel line on the opposite side of price — connecting the swing highs in an uptrend, or the swing lows in a downtrend — to form a channel. This gives a rough sense of both the trend’s direction and its typical range of movement, useful for judging whether a pullback (or rally) is proportionate to what’s been normal for that trend, or unusually deep.
Common Drawing Mistakes
- Forcing a line through price instead of around it. A common beginner error is drawing a trendline that clips through the middle of several candles just to connect two points. A well-drawn trendline generally touches the outer edges (wicks) of the relevant swings, not the middle of the candle bodies.
- Using too steep an angle. A very steep trendline connecting two swing lows that are close together in time often breaks quickly simply because the pace it implies isn’t sustainable — steep lines are broken far more often than moderate ones.
- Re-drawing the line after every pullback to make it “fit.” If you find yourself constantly erasing and re-angling a trendline to avoid it being broken, that’s usually a sign the original trend structure has already changed, whether or not you want to admit it on the chart.
- Ignoring the timeframe. A trendline drawn on a 15-minute chart may be irrelevant to the broader picture on the daily chart. Always be clear about which timeframe a given trendline applies to.
Trading Trendline Bounces
The most common use of a validated trendline is watching for price to approach it again and bounce — similar to trading a horizontal support/resistance zone, but with the added context of an established directional bias.
Example: In the AUD/USD uptrend above, once the trendline has three confirmed touches, a fourth approach toward the line (say, a pullback to around 0.6590 as the line itself has risen with the trend) combined with a bullish candlestick pattern gives a trader a defined, lower-risk entry with a stop-loss placed just below the trendline.
Trendline Breaks: Confirmation Matters
A single candle poking through a trendline isn’t necessarily a genuine break — it could be noise or a brief liquidity grab before the trend resumes (a false break). Many traders wait for:
- A candle to close clearly beyond the line, not just wick through it
- Ideally, a retest of the broken line from the other side (the same retest concept used with horizontal support and resistance)
- Confirmation from another tool — an indicator turning, a chart pattern completing — rather than the trendline break alone
Example: If the gold downtrend line described earlier is broken by a strong bullish candle closing at 2,395 (clearly above the line, which sat around 2,388 at that point), and price then dips back to retest 2,388 as new support before continuing higher, that sequence — break, retest, continuation — is a materially more convincing reversal signal than the initial break candle by itself.
Key Takeaways
- A trendline connects rising swing lows (uptrend) or falling swing highs (downtrend) and acts as a diagonal, moving version of support/resistance.
- A line isn’t considered validated until price touches and respects it a third time.
- Draw trendlines along the outer wicks of relevant swings, not through the middle of candle bodies, and avoid overly steep angles that break quickly.
- Adding a parallel line on the opposite side creates a trend channel, useful for judging whether pullbacks are proportionate to the trend’s normal range.
- A trendline break should ideally be confirmed by a candle close beyond the line and, where possible, a retest — a single wick through the line is not reliable confirmation on its own.
- Always be clear which timeframe a trendline was drawn on, since relevance doesn’t automatically transfer across timeframes.
Trendline analysis is a natural companion to support and resistance explained and technical analysis for beginners — worth reading alongside this guide.
Risk warning: Trading carries a high level of risk to your capital. Trendlines are a visual analysis tool and do not guarantee future price direction. Only trade with money you can afford to lose.
Frequently asked questions
- How many points do I need to draw a valid trendline?
- Technically two points define a line, but a trendline isn't considered meaningfully validated until price has touched or respected it a third time. A line drawn through only two points is still a hypothesis; a third touch that reacts as expected gives it real technical significance.
- What's the difference between a trendline and a trend channel?
- A trendline is a single line connecting swing lows (in an uptrend) or swing highs (in a downtrend). A trend channel adds a second, parallel line on the opposite side of price, creating a channel that shows both the trend direction and a rough boundary for pullbacks and rallies within it.
- Does a trendline break always mean the trend is over?
- Not necessarily. Price can pierce a trendline briefly and then resume the original trend (a false break), or it can break and re-test the line from the other side before reversing. A single touch below an uptrend line is a warning sign, not automatic proof the trend has ended — waiting for a confirmed close beyond the line, ideally with other supporting evidence, reduces (but doesn't eliminate) false signals.